A New Look at Network Diagrams
From Henry Gantt to Activity-on-Edge: How Schedule Visualization Continues to Evolve
Origins: A Century of Schedule Visualization
The Gantt Chart (circa 1910–1915)
Gantt charts were developed by Henry Gantt around 1910–1915, originally to help manage industrial production schedules. They became widely adopted during World War I for tracking military production and logistics. Their enduring appeal lies in their simplicity: tasks laid out as horizontal bars against a calendar, immediately communicating when work starts, how long it lasts, and where activities overlap.
The Network Diagram (late 1950s)
Network diagrams emerged from two independent efforts in the late 1950s:
- The U.S. Navy's PERT (Program Evaluation and Review Technique), developed for the Polaris missile program
- DuPont's CPM (Critical Path Method), created to manage complex plant maintenance projects
Both were born from a common problem: thousands of interrelated tasks that simple bar charts could not adequately capture. Their key innovation was the concept of the critical path — the longest chain of dependent tasks that determines a project's minimum possible duration. Knowing the critical path tells planners exactly where delays will cascade and where float (slack) exists, enabling smarter risk and resource decisions.
How Each View Helps Schedule Planners
Gantt Charts: The Timeline View
Gantt charts give planners a clear timeline view. They are excellent for communicating schedules to stakeholders, tracking progress at a glance, and managing resource assignments. The tradeoff is that dependency logic between tasks becomes hidden or cluttered when projects grow complex.
Network Diagrams: The Logic View
Network diagrams give planners a logic view. Tasks are represented as nodes or arrows connected by dependency lines, showing which activities must finish before others can begin. This makes it easy to see which activities are performed in parallel — typically requiring more coordination — versus those running in series.
Network Diagrams in Microsoft Project
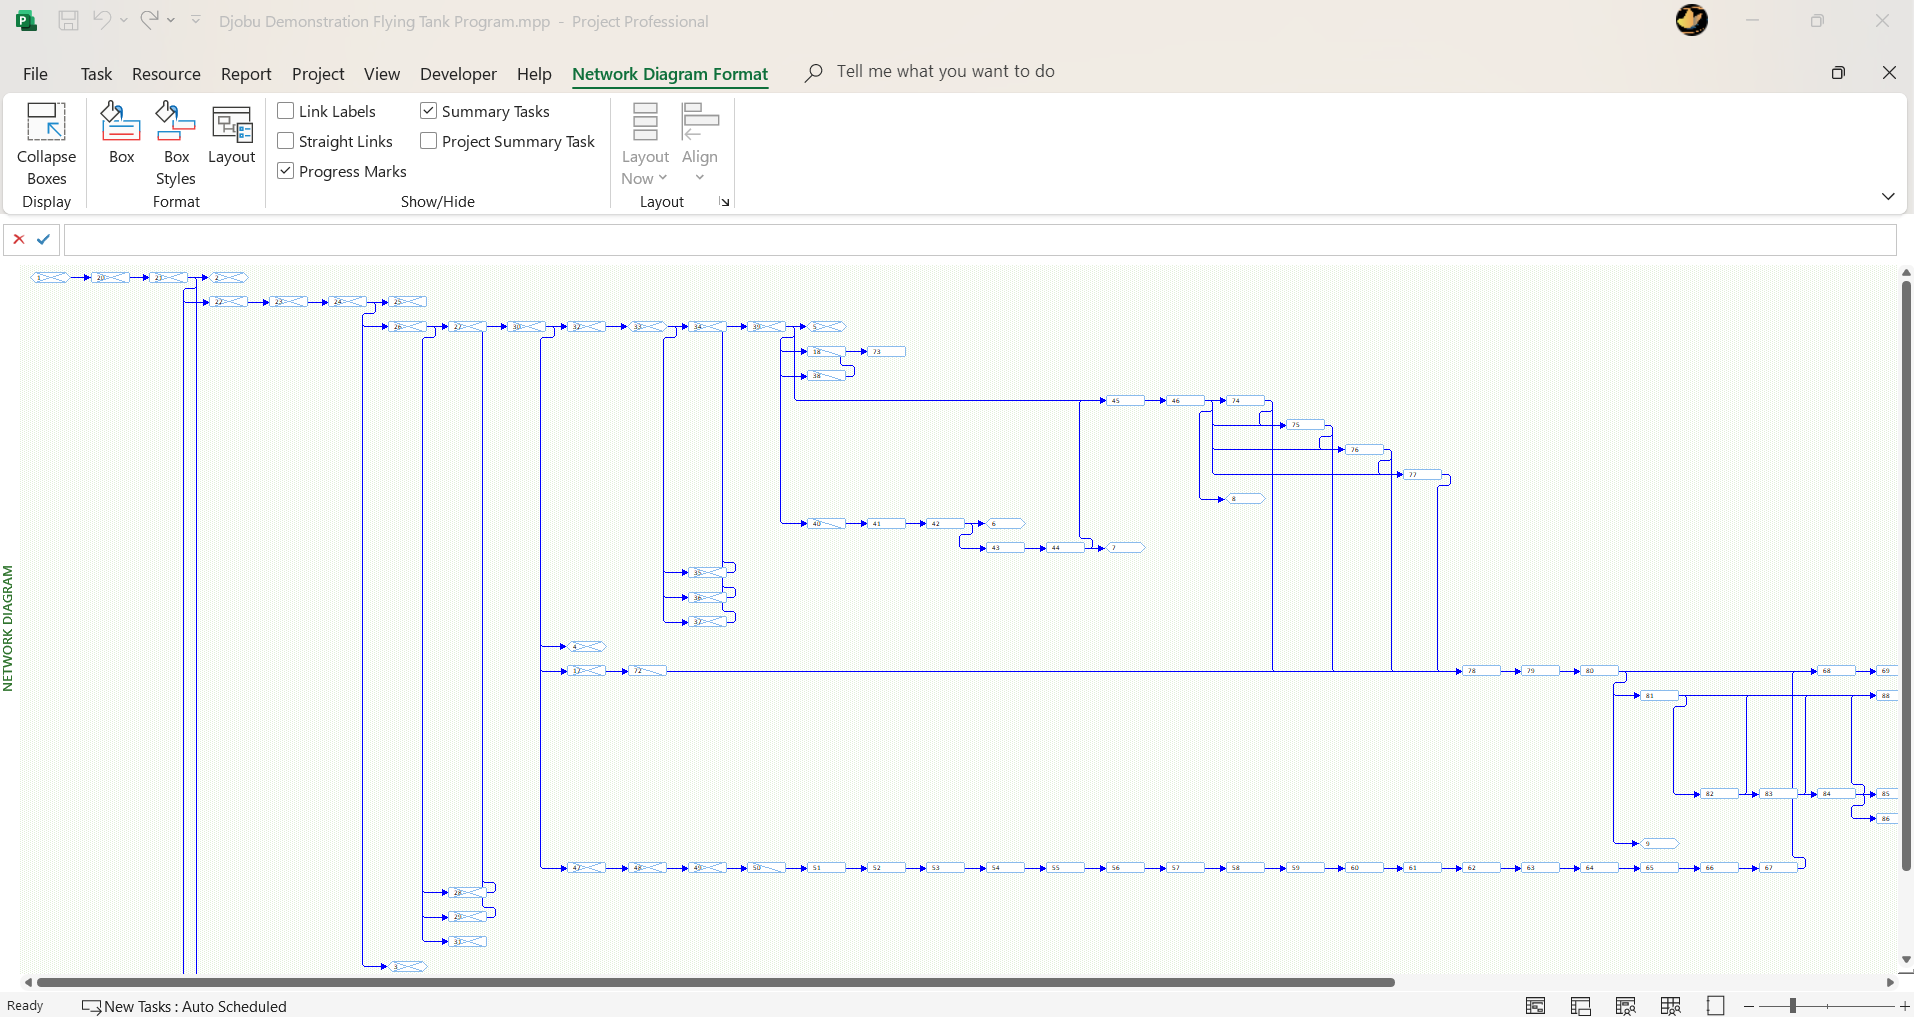
Modern project management tools like Microsoft Project combine both views: the network diagram defines the logic, and the Gantt chart is generated from it. Here is a summary of what planners can do in MS Project's Network Diagram view:
Viewing and Navigating the Schedule
The Network Diagram displays tasks as boxes (nodes) with dependency lines connecting them. Critical tasks are highlighted in red; non-critical tasks in blue; milestones use a hexagonal shape. Planners can zoom in and out to focus on specific areas or get a bird's-eye view of the full schedule.
Building and Editing the Schedule
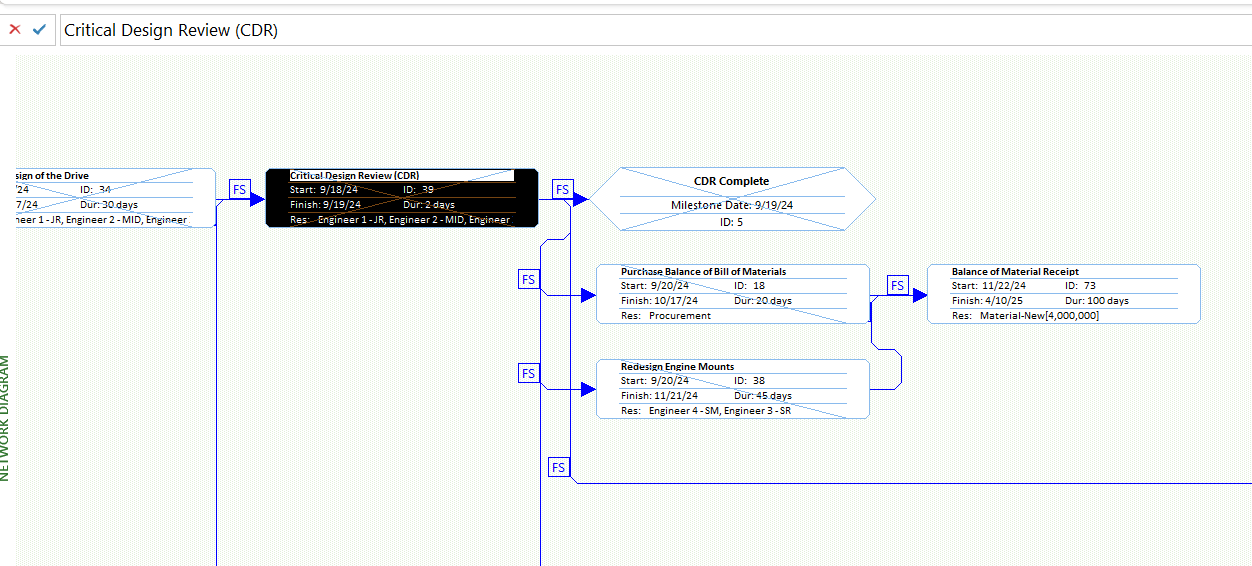
Planners can create a new project directly in the Network Diagram view or modify an existing one. To add a task, drag a rectangle in an empty area — a new node appears ready for data entry. To add a task already linked to an existing one, drag from an existing node to empty space. Each node contains five default fields by default: Task Name, Task ID, Scheduled Start Date, Scheduled Finish Date, and Task Duration.
Managing Link Lines and Dependencies
Dependency lines can be displayed as straight lines or as rectilinear segments (horizontal and vertical at right angles). Labels on link lines can show the dependency type (FS, SS, FF, SF) and any lead or lag time. Arrows can be added to indicate predecessor/successor direction, which is especially helpful when reviewing complex networks.
Controlling Hierarchy and Layout
Summary tasks can be expanded or collapsed to control the level of detail shown. The layout can be set to automatic (MS Project positions the boxes) or manual (the planner drags boxes into position). Box arrangement, alignment, spacing, height, and width are all configurable. Box styles — border shape, color, and width — can be customized per task type using data templates.
Tracking Progress
The view visually differentiates task status: a diagonal line through a box indicates a task is in progress; crossed diagonal lines indicate it is complete; an unmarked box is not yet started. Progress marks can be toggled on or off.
Next Generation: ProjectXL Network Diagram Capabilities
While MS Project's network diagram has served planners well for decades, it operates on an Activity-on-Node (AON) model — every task is a box, and dependencies are lines between boxes. ProjectXL introduces Activity-on-Edge (AOE) modeling, which unlocks capabilities that traditional tools cannot support natively.
True Hammock Tasks
A hammock task is a summary-like activity whose duration is determined entirely by the span between two specific points in the network — its start is tied to one predecessor event and its finish is tied to a different successor event. In MS Project, hammocks are approximated using manual constraints or resource-leveled summary tasks, which are fragile and prone to drift.
In ProjectXL, hammock tasks are a first-class schedule element. They are defined by their two anchor events in the network, and their duration calculates automatically as the network is solved. This makes them ideal for modeling:
- Program management overhead that spans a phase
- System engineering effort tied to the first and last technical event in a phase
- Quality assurance activities that must begin when work starts and finish when it finishes
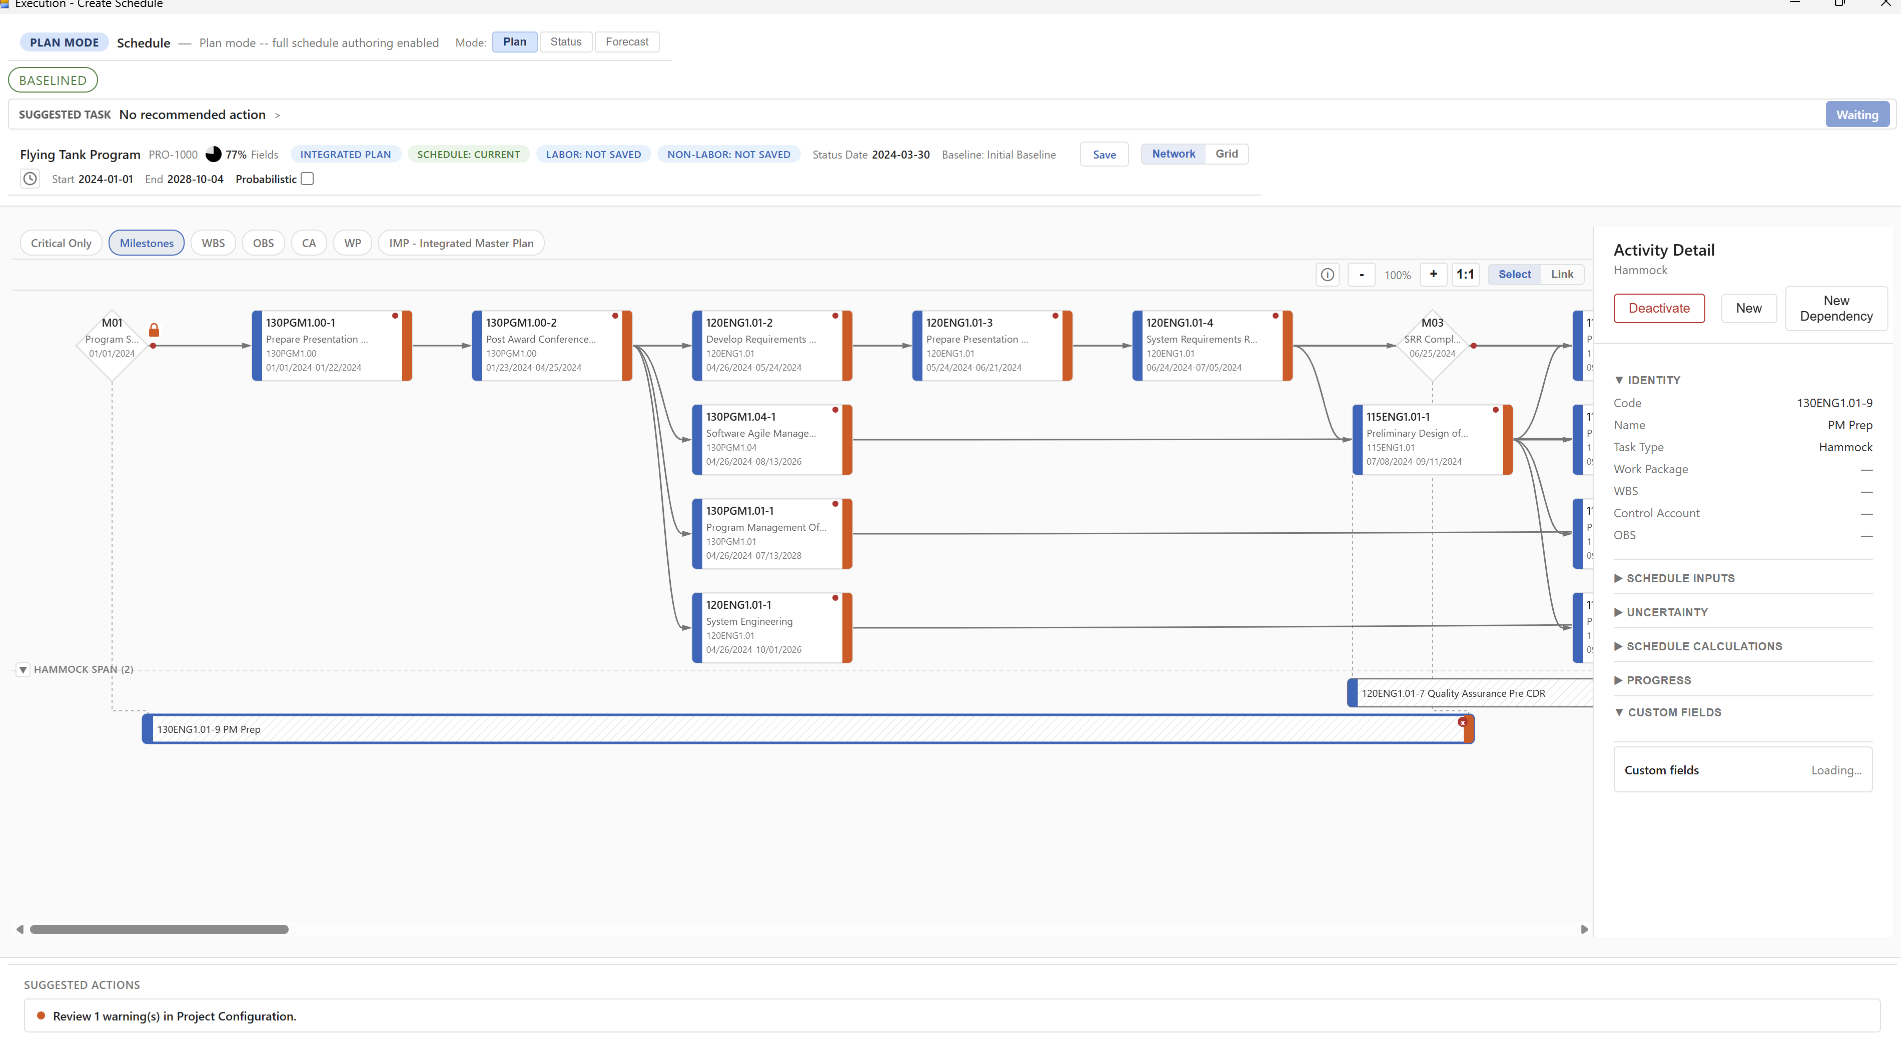
As shown above, the selected hammock task PM Prep (130ENG1.01-9) spans from early in the program through a key system engineering event. Its start and finish are anchored to network events rather than to explicit predecessor/successor task relationships, allowing the schedule logic to drive its duration without manual intervention.
Ties to Non-Task Events
In traditional AON tools, every dependency must connect two tasks. ProjectXL's AOE model allows dependencies to be anchored to events — points in the network that may represent milestones, contractual tie points, external interfaces, or program-level decisions — without requiring a "dummy" task to serve as a connector.
This directly supports common program management constructs such as:
- Milestone-to-task and task-to-milestone dependencies with explicit event semantics
- Interface events shared across subsystems or contracts
- Integrated Master Plan (IMP) event ties that do not map to a single deliverable task
The Link Builder
Building and managing complex logic networks is dramatically simpler with ProjectXL's Link Builder panel. Rather than navigating a graphical canvas to draw individual connections, the planner selects a task, then uses the Link Builder to:
- View all existing predecessor and successor connections in one place
- Search for and select successors or predecessors by activity code or name
- Filter the activity list by type (Task, Milestone, Hammock, Material Plan, Procurement, Travel, External)
- Select the dependency type (Finish-to-Start, Start-to-Start, etc.) from a dropdown
- Add new dependencies without leaving the panel
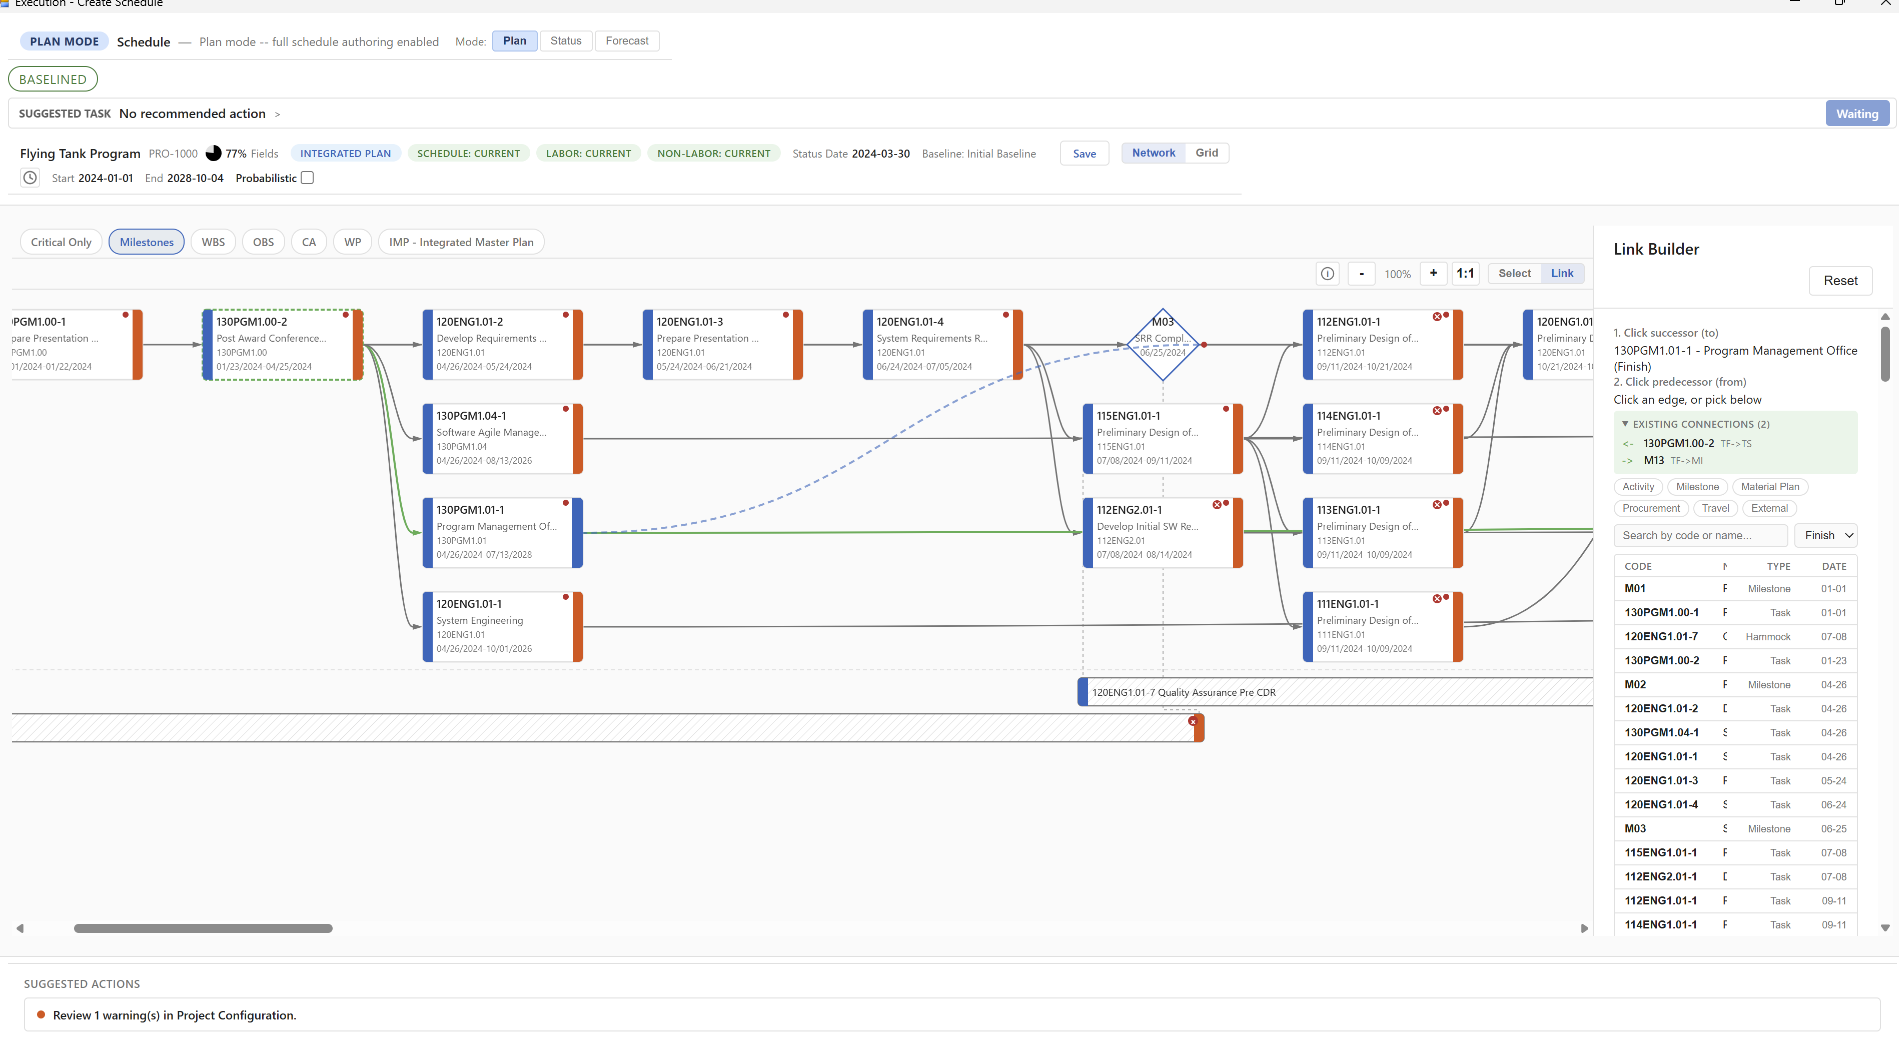
The Link Builder panel shown above is open on milestone M03 (SRR Complete). The panel displays its two existing connections — a Finish-to-Start from 130PGM1.00-2 and a tie to M13 — and presents the full activity list below, allowing the planner to quickly wire additional logic without hunting through the diagram.
Comparing the Approaches
| Gantt Chart | Network Diagram (MS Project) | ProjectXL Network Diagram | |
|---|---|---|---|
| Best for | Communicating timelines, tracking progress | Analyzing dependencies, finding critical path | Full logic + timeline + hammocks + non-task ties |
| Strength | Visual clarity for stakeholders | Logical rigor for complex sequencing | Activity-on-Edge precision with rich context |
| Weakness | Dependencies can get cluttered | Hard to read calendar dates at a glance | Requires disciplined data model |
| Typical use | Ongoing project tracking | Planning phase, schedule risk analysis | Integrated baseline development & control |
Conclusion
Network diagrams have come a long way since the PERT charts of the 1950s. Microsoft Project brought network logic to the desktop and made critical path analysis accessible to program managers everywhere. ProjectXL builds on this foundation with Activity-on-Edge modeling that brings true hammock tasks, event-based ties, and a purpose-built Link Builder to the schedule planner's toolkit.