Beginner’s Guide: Extracting Project Online Data into Power BI & Excel with Power Query
A step-by-step guide to pulling project task data from the Project Online Reporting API using Power Query in Excel or Power BI. Covers API access, field selection, JSON-to-table conversion, and date format transformations.
Overview
This guide provides step-by-step instructions for extracting and transforming project task data from Microsoft Project Online using Power Query. By leveraging the Project Online Reporting API, you can pull structured JSON data into Excel or Power BI, convert it into a usable table, and apply necessary transformations for better reporting. This approach allows users to efficiently analyze project metrics, track task progress, and automate data retrieval.
What is the Project Online Reporting API?
Microsoft Project Online provides a Reporting API that allows users to extract project and task data in a structured format. This API is a REST-based service that delivers project data in JSON format, making it easy to integrate with reporting tools like Power BI and Excel. By accessing the API, users can retrieve key project metrics, track task progress, and generate custom reports.
Test Your Access Using Your Browser
You can explore the Project Online Reporting API directly in your web browser by navigating to the root node. To do this:
- Open your browser and log in to Project Online.
- Edit the following URL, replacing {yourcompany} with your actual SharePoint site name and pwa with your actual site URL if needed:
https://{yourcompany}.sharepoint.com/sites/pwa/_api/ProjectData
- Press Enter to load the page.
- The browser will display a structured JSON response showing available datasets such as Projects, Tasks, Assignments, and more.
This is a useful way to verify API connectivity and explore available fields before writing queries.
Step 1: Open Power Query in Excel or Power BI
Before extracting data, you need to open Power Query. Follow these steps based on your tool:
In Excel:
- Open Excel and navigate to the Data tab.
- Click on Get Data > From Other Sources > Blank Query.
- This will open the Power Query Editor where you can enter your query.
In Power BI:
- Open Power BI and click Common data sources from the Home ribbon.
- Select Blank query. This will launch the Power Query Editor where you can enter your query.
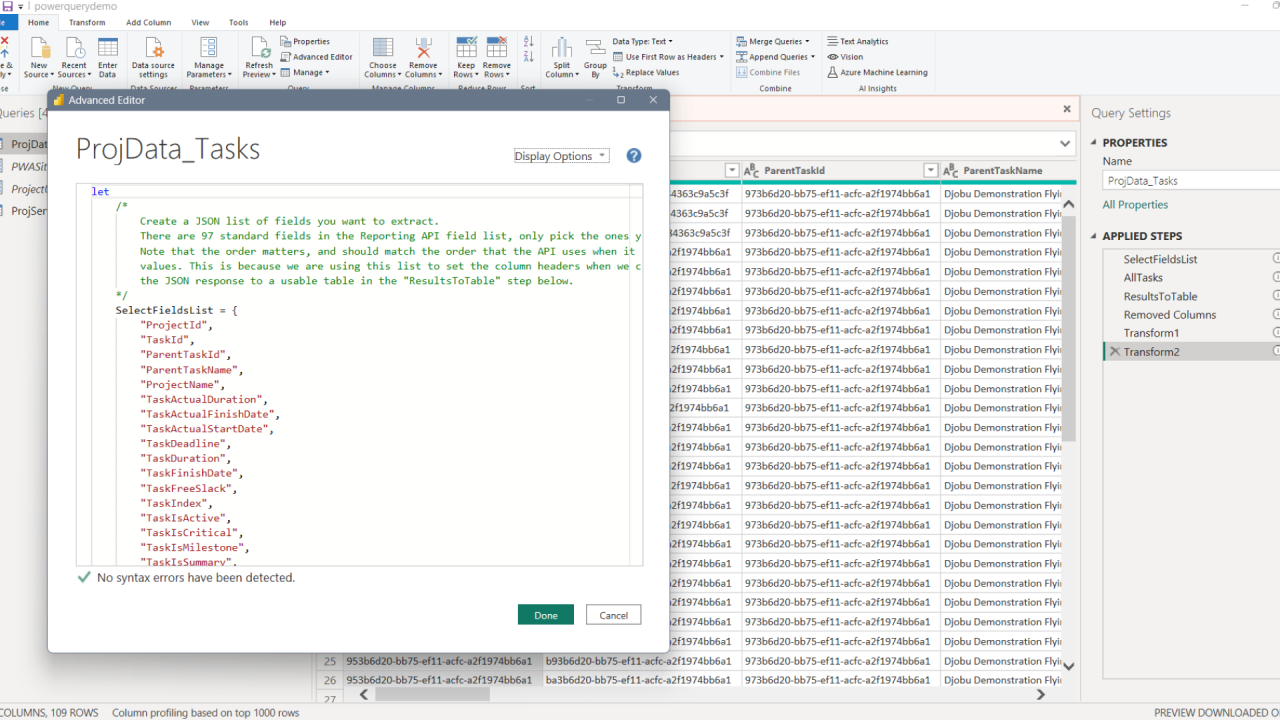
Step 2: Define the Fields to Extract
There are 97 standard fields available in the Project Online Reporting API. To improve performance and simplify data processing, it is important to limit the selection to only the fields that are necessary for your report. We'll put those fields in a JSON list for use later:
let
  SelectFieldsList = {
      "ProjectId", "TaskId", "ParentTaskId", "ParentTaskName", "ProjectName",
      "TaskActualDuration", "TaskActualFinishDate", "TaskActualStartDate",
      "TaskDeadline", "TaskDuration", "TaskFinishDate", "TaskFreeSlack",
      "TaskIndex", "TaskIsActive", "TaskIsCritical", "TaskIsMilestone",
      "TaskIsSummary", "TaskName", "TaskOutlineLevel", "TaskOutlineNumber",
      "TaskPercentCompleted", "TaskPhysicalPercentCompleted", "TaskRemainingDuration", "TaskStartDate"
  },
Step 3: Retrieve Data from the Reporting API
Use the Web.Contents function to call the Reporting API with the selected fields.
Note: The parameters PWASiteUrl and ProjectUID must either be created or replaced with hard-coded values.
- Example PWASiteUrl: https://{yourcompany}.sharepoint.com/sites/{yoursitename}
- Example ProjectUID: 95d45d20-bb75-ef11-acfc-a2f1439cd6a1
You can find your ProjectUID by navigating to the project in Project Online and checking the URL.
If you need help creating and editing parameters in Power Query, refer to Microsoft's documentation: Parameters - Power Query | Microsoft Learn.
AllTasks = Json.Document(
    Web.Contents(
        PWASiteUrl & "/_api/ProjectData",
        [
            RelativePath = "/Tasks",
            Query = [
                #"$select" = Text.Combine(SelectFieldsList, ", "),
                #"$filter" = "ProjectId eq guid'" & ProjectUID & "'"
            ],
            Headers = [
                #"Content-Type" = "application/json; charset=UTF-8",
                #"Accept" = "application/json;odata=verbose"
            ]
        ]
    )
)[d][results],
Step 3: Convert JSON Response to Table
Convert the JSON response into a structured Power Query table.
ResultsToTable = Table.FromList(AllTasks, Record.FieldValues, List.InsertRange(SelectFieldsList, 0, {"metadata"}), null, ExtraValues.Ignore),
#"Removed Columns" = Table.RemoveColumns(ResultsToTable, {"metadata"}),
Step 4: Set Data Types for Columns
Apply proper data types to ensure accuracy in calculations and reporting.
Transform1 = Table.TransformColumnTypes(#"Removed Columns", {
    {"ProjectId", type text}, {"TaskId", type text}, {"ParentTaskId", type text},
    {"ParentTaskName", type text}, {"ProjectName", type text}, {"TaskName", type text},
    {"TaskIsActive", type logical}, {"TaskIsCritical", type logical}, {"TaskIsMilestone", type logical},
    {"TaskIsSummary", type logical}, {"TaskActualDuration", type number}, {"TaskDuration", type number},
    {"TaskFreeSlack", type number}, {"TaskRemainingDuration", type number}, {"TaskIndex", Int64.Type},
    {"TaskOutlineLevel", Int64.Type}, {"TaskOutlineNumber", Int64.Type}
}),
Step 5: Convert API Date Fields to Readable Format
Microsoft Project Online returns date values in a Unix timestamp format enclosed in a string (e.g., /Date(1726592400000)/). These timestamps represent the number of milliseconds since January 1, 1970 (the Unix epoch). Excel and Power BI, however, use a different date system, where dates are stored as serial numbers starting from January 1, 1900.
To correctly interpret these timestamps:
- First, extract the numeric value from the string using Text.BetweenDelimiters(_, "(", ")").
- Convert the extracted milliseconds to days by dividing by 86,400,000 (the number of milliseconds in a day).
- Adjust the resulting value by adding 25,569, which represents the number of days between January 1, 1900, and January 1, 1970, to align with Excel's date system.
The following transformations ensure that all date fields are properly converted into a human-readable datetime format:
Transform2 = Table.TransformColumns(Transform1, {
    {"TaskActualFinishDate", each DateTime.From(Number.FromText(Text.BetweenDelimiters(_, "(", ")"))/86400000+25569), type datetime},
    {"TaskActualStartDate", each DateTime.From(Number.FromText(Text.BetweenDelimiters(_, "(", ")"))/86400000+25569), type datetime},
    {"TaskStartDate", each DateTime.From(Number.FromText(Text.BetweenDelimiters(_, "(", ")"))/86400000+25569), type datetime},
    {"TaskFinishDate", each DateTime.From(Number.FromText(Text.BetweenDelimiters(_, "(", ")"))/86400000+25569), type datetime},
    {"TaskPhysicalPercentCompleted", each _/100, Percentage.Type},
    {"TaskPercentCompleted", each _/100, Percentage.Type}
})
in
    Transform2
Try It Yourself!
To get started, open a blank query in Power Query by following these steps:
- Open Excel and navigate to the Data tab.
- Click on Get Data > From Other Sources > Blank Query.
- In the Power Query Editor, open the Advanced Editor (found under the Home tab).
- Paste the following code into the Advanced Editor window and click Done.
Now that you understand the process, copy and paste the full Power Query script into your Power Query Editor and run it against your Project Online data. Experiment with modifying the selected fields or adding additional transformations to customize the output for your needs.
Full Example Code
Below is the complete Power Query script for extracting and transforming Project Online task data. Use this as a starting point for your own reports:
let
    SelectFieldsList = {
        "ProjectId", "TaskId", "ParentTaskId", "ParentTaskName", "ProjectName",
        "TaskActualDuration", "TaskActualFinishDate", "TaskActualStartDate",
        "TaskDeadline", "TaskDuration", "TaskFinishDate", "TaskFreeSlack",
        "TaskIndex", "TaskIsActive", "TaskIsCritical", "TaskIsMilestone",
        "TaskIsSummary", "TaskName", "TaskOutlineLevel", "TaskOutlineNumber",
        "TaskPercentCompleted", "TaskPhysicalPercentCompleted", "TaskRemainingDuration", "TaskStartDate"
    },
    AllTasks = Json.Document(
        Web.Contents(
            PWASiteUrl & "/_api/ProjectData",
            [
                RelativePath = "/Tasks",
                Query = [
                    #"$select" = Text.Combine(SelectFieldsList, ", "),
                    #"$filter" = "ProjectId eq guid'" & ProjectUID & "'"
                ],
                Headers = [
                    #"Content-Type" = "application/json; charset=UTF-8",
                    #"Accept" = "application/json;odata=verbose"
                ]
            ]
        )
    )[d][results],
    ResultsToTable = Table.FromList(AllTasks, Record.FieldValues, List.InsertRange(SelectFieldsList, 0, {"metadata"}), null, ExtraValues.Ignore),
    #"Removed Columns" = Table.RemoveColumns(ResultsToTable, {"metadata"}),
    Transform1 = Table.TransformColumnTypes(#"Removed Columns", {
        {"ProjectId", type text}, {"TaskId", type text}, {"ParentTaskId", type text},
        {"ParentTaskName", type text}, {"ProjectName", type text}, {"TaskName", type text},
        {"TaskIsActive", type logical}, {"TaskIsCritical", type logical}, {"TaskIsMilestone", type logical},
        {"TaskIsSummary", type logical}, {"TaskActualDuration", type number}, {"TaskDuration", type number},
        {"TaskFreeSlack", type number}, {"TaskRemainingDuration", type number}, {"TaskIndex", Int64.Type},
        {"TaskOutlineLevel", Int64.Type}, {"TaskOutlineNumber", Int64.Type}
    }),
    Transform2 = Table.TransformColumns(Transform1, {
        {"TaskActualFinishDate", each DateTime.From(Number.FromText(Text.BetweenDelimiters(_, "(", ")"))/86400000+25569), type datetime},
        {"TaskActualStartDate", each DateTime.From(Number.FromText(Text.BetweenDelimiters(_, "(", ")"))/86400000+25569), type datetime},
        {"TaskStartDate", each DateTime.From(Number.FromText(Text.BetweenDelimiters(_, "(", ")"))/86400000+25569), type datetime},
        {"TaskFinishDate", each DateTime.From(Number.FromText(Text.BetweenDelimiters(_, "(", ")"))/86400000+25569), type datetime},
        {"TaskPhysicalPercentCompleted", each _/100, Percentage.Type},
        {"TaskPercentCompleted", each _/100, Percentage.Type}
    })
in
    Transform2
Conclusion
This Power Query script efficiently extracts task data from Microsoft Project Online, transforms JSON responses into a structured table, and applies necessary formatting. You can use this approach to automate data retrieval and improve reporting in Excel or Power BI.